Top 3 Ways a Map Helps Reduce Emissions

Find, fix, and prevent carbon emissions with a map of your operations process leveraging collaborative control, automation, and artificial intelligence.
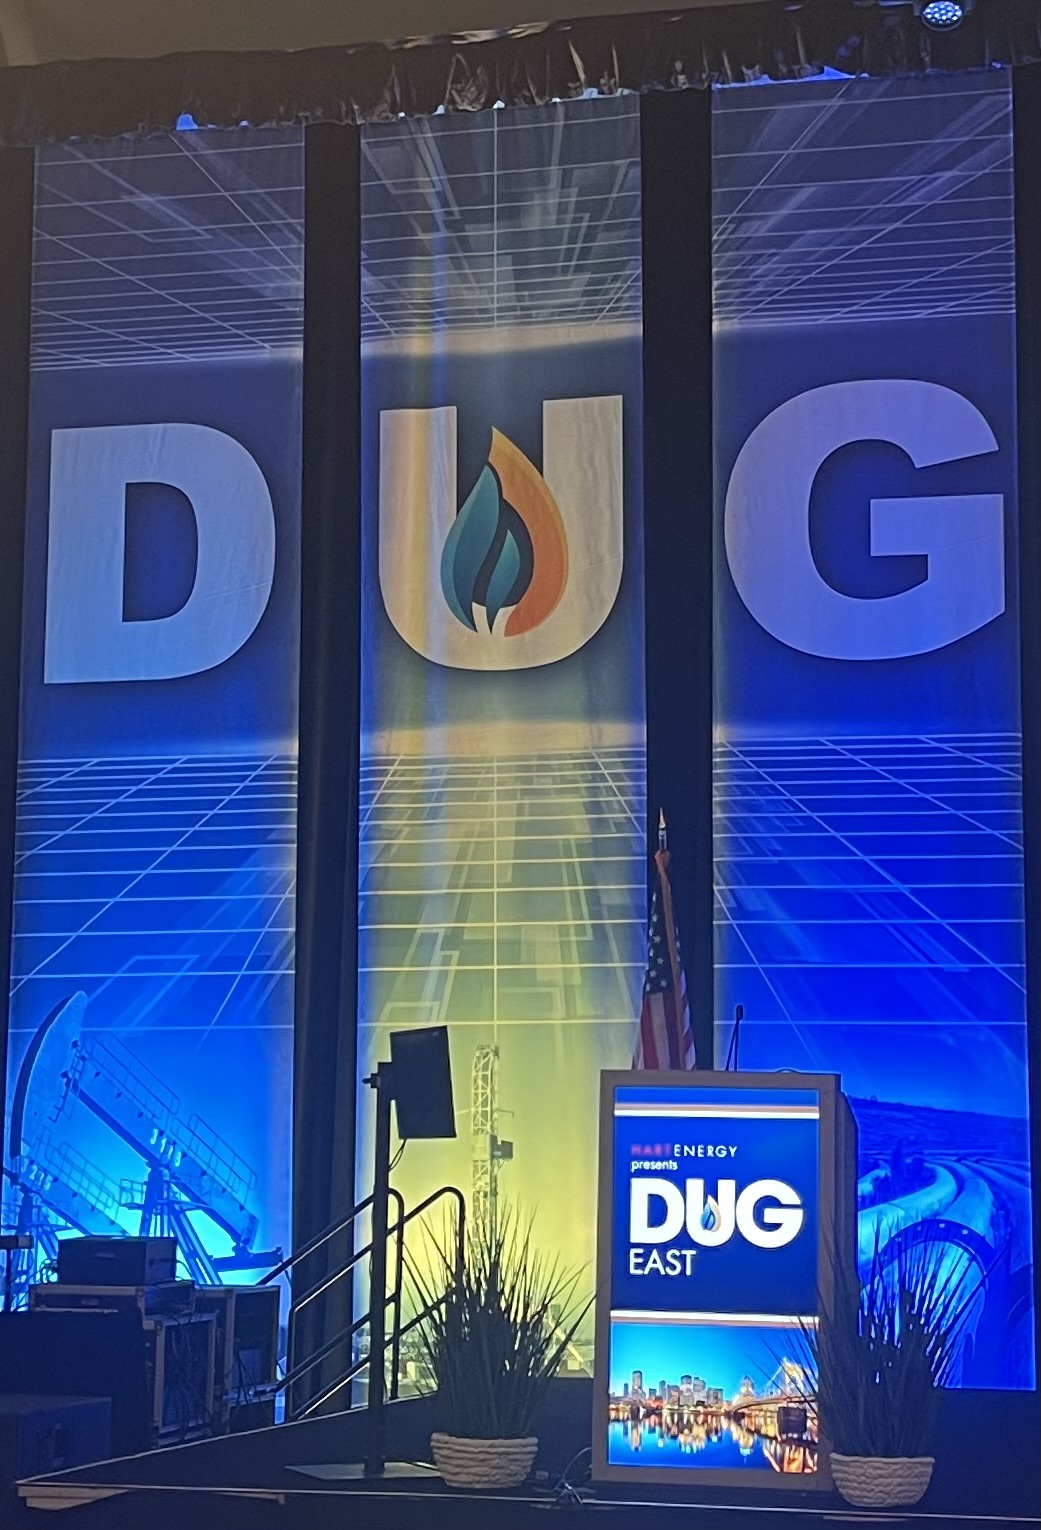
How can companies cut down on carbon emissions? The genie is out of the bottle about the need to lower carbon emissions, starting now, not tomorrow. The urgency and the immediate need to hit net-zero goals are front and center everywhere, even in oil and gas — as reflected in a recent meeting of the minds in Pittsburgh, PA at the DUG East conference.
“Where this conversation [oil and gas production] has to go is towards a balanced energy policy,” reflected Josh Viets, EVP and COO at Chesapeake Energy. “And I think it’s important that we contemplate three important principles around any good energy policy, and that has to balance affordability, reliability, and creating a lower carbon future.”
But how?
During the DUG conference, the premise played out is the role of natural gas in offsetting the demand for coal production, thereby helping to “transition” the oil and gas sector to meet net-zero goals.
This is only one component of a larger strategy. More must be done to meet net-zero goals. Specifically, engineers, operators, and executives need to formulate an approach to:
- Find carbon emission offenders in any production environment.
- Fix the issues causing larger carbon emissions.
- Prevent this from happening again.
Again, how can companies cut down on carbon emissions, exactly?
Let’s start by understanding what so many organizations are struggling to locate, track, and lower.
According to the Center for Sustainable Systems at the University of Michigan, a carbon footprint is defined as total greenhouse gas (GHG) emissions caused directly and indirectly by an individual, organization, event, or product, and it is calculated by summing the emissions resulting from every stage of a product or service’s lifetime (material production, manufacturing, use, and end-of-life).
Throughout a product’s lifetime, or lifecycle, different GHGs are often emitted, such as carbon dioxide (CO2), methane (CH4), and nitrous oxide (N2O), each with a greater or lesser ability to trap heat in the atmosphere.
And these differences account for the global warming potential (GWP) of each gas, resulting in a carbon footprint in units of mass of carbon dioxide equivalents (CO2e).
“X” Marks the Spot
Solving for net-zero goals requires organizations to build a real-time, aggregated and accurate map of their emission offenders. And not just any map, but one that delivers three key capabilities:
- A unified view of all production systems so that engineers and operators share visibility. This includes contextual information of physical and virtual components – across the entire production process.
- Collaborative control between teams with automation that centralize the understanding of emission offenders and remediation steps. And separates steps for production line engineers, reliability engineers, process control engineers, and asset/equipment operators. This lets teams meet net-zero goals, from executives and business leaders reporting emissions numbers, to technical staff finding and fixing issues.
- A total understanding of operations with the root-cause of why systems are failing. This includes knowing how to remove bottlenecks and silos in real-time. It also means receiving actionable insights for control changes, and the ability to automate operations.
Introducing Kelvin Maps: ™ The Only Map with Emission, Controls, and Automation
Solving for emissions challenges also require companies to leverage solutions like Kelvin Maps,™ which not only paints a real-time picture of your total production process to discover the root-cause of why systems are failing, but also shows you where and why emissions occur.
Built for hitting net-zero goals, Kelvin Maps™:

Aligns financial and operational executives and leadership to determine and aggregate the true current state of their emission outputs and derive actionable intelligence on how to meet sustainability goals and mandates.Provides a single source of truth in a dashboard that provides information for several production lines at a glance, including stock-keeping unit (SKU) and shift information, team information, overall equipment effectiveness (OEE) indicators, and active alarms on equipment assets.

Empowers engineers and operators with control. Kelvin Maps™ lets users to make asset-level control changes, where they are when visualizing alarms. As a result, operators make quick, corrective actions – while having more time to plan for future optimizations. Kelvin Maps™ also lets engineers and operators automate control changes through a programmatic interface.

Teams also see process maps and details to troubleshoot alarms. The OEE indicators appear on top for quick reference. This enables production line managers to optimize for organizational goals and easily create key performance indicator (KPI) reports for executives.
Finally, Kelvin Maps™ patent-pending technology enables companies to visualize the entire production process. And Maps also lets users simulate interactive production scenarios. Together this leads to production line optimization and drastic carbon emission reductions.
Demo Kelvin Maps™ today and learn how to cut down on carbon emissions.


